

Analytics, Basic Stats, and Recent Historic Context: The ABC’s of Penn State Football – The Manny Diaz Hire, Part 2 – Comparison to Penn State Defenses

Sponsor: Join our 2022 FTB Donors Club – the best way for you to show your support and keep this train rolling – and receive an exclusive FTB zipper bottle Koozie as a gift! Sign up HERE.
*Please remember to click the ‘Share My Address With For The Blogy’ box when checking out so we know where to mail your gift!
Introduction
In Part 1 of our introduction to Manny Diaz, we used basic and advanced metrics to outline what immediate statistical impact he’s delivered in Year 1 as defensive coordinator throughout various stops in his coaching career.
Today, we’re gonna put Diaz’s body of work under a different microscope lens and compare how his teams have performed vs. past Penn State defenses and FBS defenses, at large. Coach Diaz has served as Defensive Coordinator or Head Coach in FBS since 2010 (2010 and 2015 Mississippi State, 2011-2013 Texas, 2014 Louisiana Tech, 2016-2021 Miami) and has commanded groups that have been above average in virtually every category in every year. But how did he stack up against Penn State – a program that has some incredible defenses and legendary players in the last decade-plus? How much should we temper our expectations (or not)?
Let’s find out…
Yardage
We start with yards/game and yards/play plots. And as we do, give us a minute to outline the graph template we’ll be using over and over in this blog post. The “Null” set are all FBS teams from 2009-2021 that aren’t Penn State or where Manny Diaz coached in that given year. The dots in the “Manny Diaz” column represent a data point for a particular season in which Manny Diaz was either the DC or Head Coach of a school. The Penn State column is Penn State (duh). The line and number label are the averages for each dataset.
What you’ll observe below kicks off what will become a very consistent theme throughout today’s discussion. The Penn State performance is the best in the group, followed by Diaz’s performance, followed by the field. In the case of yards/game Penn State has the 11th best average in FBS since 2009 behind schools like Alabama, Wisconsin, Florida, Georgia, and others. So, while Diaz’s teams have given up a few more yards than Penn State over the years, his defenses are still well ahead of the field. In fact, the average of Diaz’s groups would rank 24th overall (pretty damn good!).
 Same story with Yards Allowed Per Play. Penn State leads the way and has actually been the 3rd best team since 2009 in this category at 4.9 (Alabama: 4.5, Clemson: 4.8). The Lions have had so many good defenses in the last 13 years mixed in with a highly variable offensive performance. Diaz’s 5.2 yard/play average has been very strong in its own right, ranking 18th overall in that same time frame. In addition to these metrics, we also like to typically look at yard/drive, too. In this stat category, Penn State ranks 6th (27.0) and Diaz’s collective defenses rank 18th (29.0).
 Scoring

Limiting yards is obvious important. But you wanna know what’s even more important? Limiting points! Look no further than Penn State’s 2021 season. The final edition of Brent Pry’s defense kept opponents off the scoreboard, which in turn kept Penn State in ever game it played in spite of its inconsistent offense. Shudder to think what Penn State’s 2021 final record would have been without that stout defense.
Since 2009, Penn State has allowed 20.4 PPG against FBS opponents. In those same 13 seasons, the overall FBS average has been 28.3 PPG – more than a touchdown difference! That 20.4 PPG mark ranks 6th overall behind Alabama (15.4), Wisconsin, Iowa, Ohio State, and Clemson. Impressive.
 Coach Diaz’s teams have allowed 24.0 PPG, which again is a really good number and would rank 22nd in FBS. It’s just that Penn State’s defenses have been better. The main reason? Well, as you can see from the graph Diaz has had a couple of dots rest above the 28.3 line (2012 Texas: 29.2 and 2021 Miami: 31.0). But otherwise his teams have been better than average with one year below 20.0 PPG.
In recent editions of ABC’s, we’ve written a lot about the Penn State defense’s ability to limit Red Zone scoring in 2021. In fact, once the opponents moved the ball inside the Nittany Lions’ 20 last season, Penn State’s defenses was one of the best units overall in the past decade. The graph below shows that both Penn State and Manny Diaz’s Red Zone performance over the timeframe were somewhat better than the FBS average and while it looks like Diaz has the slight edge, his defenses and Penn State’s defenses are statistically the same.

Taking things one step further, let’s examine total Red Zone points-per-game (Points per RZ Attempt * RZ Attempts) to calculate the total Red Zone allowance of these defenses. With Penn State, we get 13.8 RZ PPG (2.9 RZ attempts/game). For Manny Diaz, we end up with 16.3 (3.5 attempts). Those two data points reside in the same neighborhood and are both better than the FBS average. On average since 2009, Penn State ranks 11th and Manny Diaz ranks 24th in RZ PPG allowed.
 Finally for scoring, we broke down points scored on plays that originated outside of Red Zone (PORZ). Again, this is a new stat we’re toying with that. On the offensive side, we believe PORZ is a great measure of a team’s explosivity. Conversely, on the defensive side, this stats illustrates a team’s ability to limit explosive plays. An average defense yields 10 PORZ per game. Again, both Penn State and Manny Diaz’s defenses have been better than average since 2009 in PORZ. It’s notable just how good Penn State has been in this metric. The Nittany Lions rank 4th overall (behind Alabama, Iowa, and Ohio State) and have 4 seasons that land in the top 100 overall in PORZ out of 1640 teams. Manny Diaz’s teams haven’t been bad, either. In 10 of 12 seasons, his defenses were better than the FBS average in PORZ.
 Havoc
Havoc

As discussed in Part 1, one of the hallmarks of Manny Diaz’s defenses has been the ability to create negative plays. In the table below, we have the average Sacks+TFL per game that his teams have had compared to Penn State and the rest of the FBS field. An average defense registers 8 Sack+TFL per game. Penn State’s 9.6 ranks 3rd in FBS behind Clemson (11.0) and Texas A&M (9.7). Manny Diaz’s teams have averaged 10.7 of these plays, which would put them 2nd behind only Clemson.
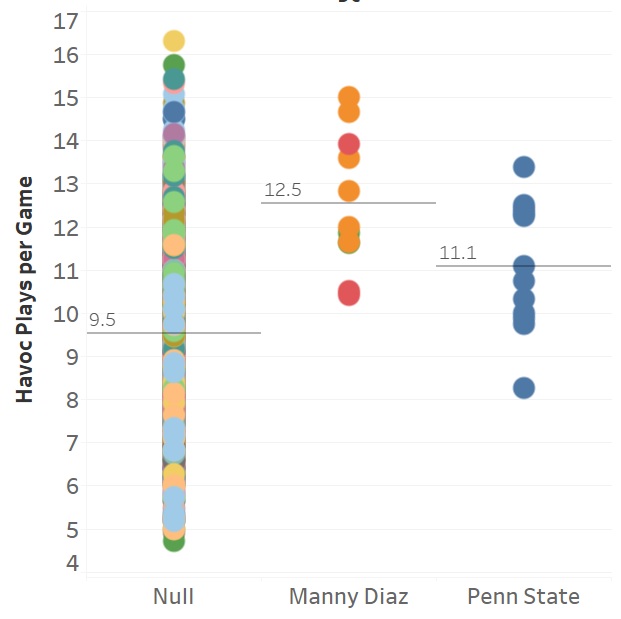
 Now let’s add in turnovers to give us total Havoc plays per game. Once again, Diaz’s defenses reign supreme in this category. The average FBS team generates 1.6 turnovers per game (9.5 Havoc Plays – 7.9 Sack+TFL). Since 2009, Penn State has generated 1.5 turnovers per game (67th) – a number that’s below average. No such issues for Diaz’s defense. They average in the top 15 in turnover generation at 1.8/game. Spread this out over an entire season, and it means Diaz’s defenses have average roughly 4 more turnovers per year than Penn State.

Overall Effectiveness
It might surprise you to learn that since 2009, Penn State has had the 6th best overall defense. That’s behind Alabama but on par with Wisconsin, Clemson, Ohio State, Iowa, Georgia, and Florida and substantially better than the Michigan schools, LSU, Notre Dame and others. Needless to say, in Happy Valley, defensive expectations have always been high and remain that way to this day.

Manny Diaz’s 23.5 average Overall Effectiveness would rank 18th and be on par with Michigan, Michigan State, LSU, Utah and Virginia Tech. So no, Diaz doesn’t usually produce Penn State-level defenses, but he’s also never had Penn State-level players to coach. Furthermore, as we showed in part 1, there has posted considerable evidence that he doesn’t let his defensive units go backwards once he’s handed the controls. In fact, his defenses tend to improve drastically in Year 1. My belief is that Diaz will blend his experience with the culture, tradition, and existing defensive philosophy at Penn State and take it to the next level, ultimately becoming one of the best coordinators the school has seen.


Leave a Comment