

Analytics, Basic Stats, and Recent Historic Context: The ABC’s of Penn State Football — Quantifying the Whiteout

Introduction
Since 2004, Penn State’s annual Whiteout has grown into one of the biggest spectacles in college football and college sports overall. Two-page Sports Illustrated photo spreads, ESPN spots like this video from 2012, and viral moments like Michigan being forced to call a timeout on the first play from scrimmage in 2019, have all elevated this one-time promotional gimmick and made it the greatest college football tradition of the 21st century. But, while the hype of the Whiteout is nearly unmatched, does it give Penn State an actual advantage on the field? Are there some quantifiable, statistical signs that emerge because of the Whiteout crowd?
The Opponents & Tidbits
Before we get into the specifics, let’s take a look at the teams who’ve been schedule as Penn State’s Whiteout opponent over the years, starting with Purdue in 2004. Because of the Whiteout’s ‘circle the date’ stature, it’s no surprise that historical Big Ten heavyweights Michigan (6 Whiteout appearances) and Ohio State (5 Whiteout appearances) dominate the table below.
| Opponent | White Out Appearances (Years) |
| Michigan | 6 (2006, 2010, 2013, 2015, 2017, 2019) |
| Ohio State | 5 (2005, 2012, 2014, 2016, 2018) |
| Alabama | 1 (2011) |
| Illinois | 1 (2008) |
| Iowa | 1 (2009) |
| Notre Dame | 1 (2007) |
| Purdue | 1 (2004) |
Tidbits:
- Penn State is 8-8 (50%) in Whiteout games but 90-22 (80%) at home since 2004.
- Penn State is 4-2 against Michigan in Whiteouts and 2-3 against Ohio State.
- Only 2 games (2007 Notre Dame and 2011 Alabama) have been out-of-conference games. Penn State is 1-1 in these situations. The 2021 Whiteout is against Auburn.
- Penn State’s Whiteout opponents’ final records were 154-56 combined (73%) and included 9 teams that won 10+ games; only 2 teams (2007 ND and 2008 Illinois) finished with losing records.
- Whiteout Kick-off Times:
- Noon: 1 (2015 Michigan-Loss)
- Late Afternoon (3:30-6:00 PM): 5 (2-3; wins 2005 Ohio State and 2013 Michigan)
- Night (7:30 or 8:00): 10 (record: 6-4)
- Both Alabama (2011) and OSU (2014) won national championships in the years that they were the Whiteout opponents. 2012 OSU was also undefeated but ineligible for postseason play.
As you can see from the notes, on a pure win/loss standpoint, the Whiteout has yielded a far lower win-% than normal home games but also, they tend to be played against much tougher teams. Also, there should never, ever be a noon kickoff for a Whiteout. These games should only kick-off after dark, even in September.
Scoring
For starters, let’s compare scoring output in Whiteout games against what Penn State and those Whiteout opponents typically score in all other games.
In the graph below, we see that the Penn State defense has held the opposition below their seasonal scoring average in every Whiteout save one (the 2013 overtime thriller against Michigan). Now, this trend is not solely attributable to the Whiteout and the crowd, obviously. Almost every year since 2004, Penn State has finished near the top of the Big Ten in points allowed. But, especially in the Franklin era, the defense has done a nice job holding some top-tier offenses (OSU and Michigan) down well below their scoring average. When Ohio State traveled to Beaver Stadium and faced the “monochromatic mayhem” of the Whiteout in 2014, 2016 and 2018, the Buckeyes scored 15.8 points less than they averaged in all other games those seasons. Compare that to when Franklin and Co. visited the Horseshoe in 2015, 2017, and 2019 – Penn State gave up 38, 39, and 28 points, respectively. While that’s still below Ohio State’s per-game average, the dip hasn’t been as steep. On the road, Penn State has held Ohio State to 6.3 points less than what they normally score. Therefore, the difference between hosting Ohio State and visiting Ohio State has been worth roughly 10 points in Franklin Era…at least, defensively.

In terms of Penn State’s offense, it’s a bit more of a mixed bag. In five years, the PSU offense has surpassed its yearly-per-game scoring average in the Whiteout (blue bars) but in 11 years, they fell below their average (orange and brown). This obviously makes sense considering Whiteout opponents have mostly been powerhouses. Non-conference layups against schools like Idaho, Illinois State, Kent State, and Pitt tend to inflate Penn State’s per-game offensive numbers.

Therefore, maybe the best way to showcase how the Whiteout benefits Penn State’s offense is to compare the opponents’ allowed points in the Whiteout vs. all other games? Here, we see some real positivity. The Penn State offense has scored at least 1.8 more points than the opponents’ average allowed in 10 years, 3 times they’ve scored a significant amount below the opponents’ average, and 3 times they were basically spot-on. Again, there are some confounding issues here – the PSU offense is typically better than other offenses Whiteout opponents face – but performing well against these defenses is a good indicator that the Whiteout aids the Nittany Lions offense.

Penalties
Does the noise and atmosphere of Whiteouts lead to more penalties than normal for PSU’s opponents? And does PSU somehow have fewer than normal penalties? These data points are a bit confounded and cannot be contributed only to the Whiteout but the graph below shows the number of opponent penalties versus their total season average. I say it’s confounded because it isn’t just the opponents’ away split but their full season. The positive bars indicate that the opponent had more penalties during the Whiteout than it typically averaged, led by Notre Dame (2007) which had about 8 more penalties than average. In 9 of 16 Whiteouts the Lions forced more penalties than their opponent averaged the rest of the season.

The color of the graph indicates the differential of penalty yards versus average. Dark blue indicts a higher than normal amount of penalty yards, topped by Michigan’s +57 performance in 2015. Various shades of orange indicate a team had less penalty yards in the Whiteout than average. Note that 2016 Ohio State and 2019 Michigan committed more penalties than average but were docked for less penalty yards than average in each of their Whiteout losses.
On the flip side, how do the Lions fare in terms of penalties in Whiteout games? Does the atmosphere influence the refs to keep those flags in their pockets? Eh, not really.
In seven Whiteouts, Penn State was penalized more than average, although three of those were 0.6 penalties or less difference than average. That’s means Penn State was flagged less than average in nine Whiteout games – the cleanest contests being memorable wins vs. Ohio State in 2016 and Michigan in 2017.

If we focus only on the penalty differential between Penn State and its foe in Whiteout games, we see evidence that the crowd and the environment create an true home-field advantage. OK, so in this graph below we have Penn State penalties minus opponent penalties (negative bars mean more opponent penalties) and Penn State penalty yards minus opponent penalty yards (brown/orange bars mean more opponent penalty yards). I also labeled the bars with the yardage differential. In 11 Whiteout games, Penn State was penalized less than the opposition. In 12 Whiteout games, the Lions were penalized less yards than their opponent. The highest penalty yardage differential in Penn State’s favor was 87 yards vs. Michigan in 2015 – a game Penn State still lost.

Turnovers
Next, let’s look at turnovers in Whiteout games. Below are the opponent turnovers in the Whiteout minus the average opponent turnovers for the season (positive bars indicate that the PSU defense generated more turnovers that than average). Only five times has Penn State forced more than the expected turnovers and out of these, the Lions have only won two of those contests – 2005 Ohio State and 2013 Michigan.

Penn State’s offense has protected the ball better than average in all but four Whiteouts – the worst result coming in 2009 vs. Iowa (2.7 more turnovers than average.)

Penn State Splits
How does the Whiteout compare to other Penn State home games in terms of points scored and points allowed? Good question. The next graph holds the answer. The top box contains PSU points scored in home games by year. The Whiteout point total is marked in orange. All other games are blue. Wins are stars and losses are circles. The bottom box is laid out in similar fashion, but represents the opponent points scored.
It’s interesting that in four years – 2005, 2006, 2015, and 2016 – Penn State put up its lowest point total of the season in the Whiteout. It’s also interesting that two of those games – the 2005 17-10 win vs. Ohio State and the 2016 24-21 upset of Ohio State – were arguably the most significant wins in modern Penn State history. Defensively, Penn State surrendered more points in the Whiteout than any other home game six times. Still, Penn State managed to win two of those six games.

How about the opponent away game splits? Below are the points scored and allowed by our Whiteout opponent in their other away games using the same format as above. The Win/Loss is for the opponent in this case. Above, we noted that 2005 and 2016 were poor offensive outputs for Penn State. But look at the output for Ohio State. In 2005, the Buckeyes’ 10 points scored was the worst away game output they had by two touchdowns. In 2016, the 21 points the Buckeyes scored against PSU was only topped by the 17 they scored against MSU (a win). Defensively, the Whiteout served the opponent up their worst performance in points allowed four times (all wins for Penn State).

Against the Spread
It’s been said good teams win but great teams cover. Therefore, let’s analyze the Whiteout through the eyes of a gambler. The spreads for all the Whiteouts are shown below. Positive numbers are the times when PSU was an underdog with the largest coming in 2016 when OSU was favored by 19.5 points. Out of 16 games, Penn State was only favored five times with one 2012 OSU being a pick ‘em in the site that I found (another place said PSU +1; both of these numbers surprised me). So, while the win-loss record in the Whiteout isn’t as good as you might hope, you need to keep it in context that the team is often a decent underdog against the best team on the schedule.
It’s notable that in Whiteout games where the Lions were favored, they are 4-1 SU with the only loss coming in 2009 against Iowa. In the games they were underdogs or pick’em, they are 4-7 SU.

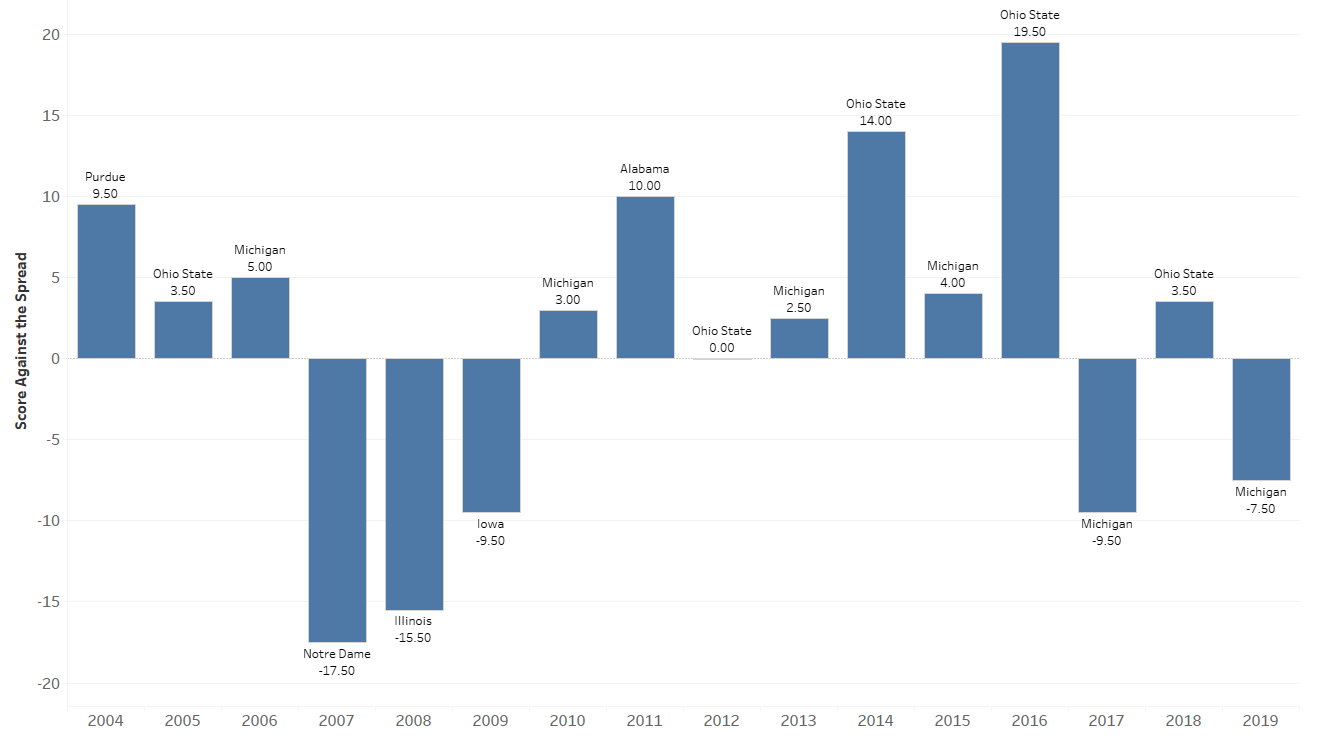
Next, we look at how Penn State has fared against the spread (ATS), i.e. the real win-loss that matters. In the graph below, positive numbers mean PSU won ATS and negative numbers are a loss. Orange bars mean they won the actual game and blue are losses. All-time, Penn State is 9-7 ATS in Whiteouts and 4-2 ATS since Franklin became head coach.


1st, thank you for doing this analysis. I’ve always been surprised a data-savvy beat reporter hasn’t done this same analysis in prior years. Seemed like a fascinating topic.
RE: Scoring — points allowed in the whiteout, to your point of, “Now, this trend is not solely attributable to the Whiteout and the crowd, obviously.” — a complimentary analysis you could do is to compare the whiteout points allowed delta vs all of the other penn state games in the same year. It would help tell if the whiteout defensive performances were special compared to PSU’s defense in the other games.
PS – nice Fowler reference with the, ““monochromatic mayhem”. Some phrases like that stick out when you go back to watch the old games.
Hey guys,
This is great stuff, just like all of the statistical analyses you do.
One question – would it perhaps be worthwhile to have a summary section after doing the deep dive into all of the various stats? Not just for this article, but for any article where you slice a bunch of varying data?
This article, for instance, could almost end with a bulleted list, with the main takeaway from each stat. I recognize that a lot of times statistical analyses can be a mixed bag of results and/or there isn’t one clear verdict, but after poring through 1,800 words and 14 graphics, a nice little “so let’s cut to the chase” section might be nice.
Just some food for thought, appreciate your work!
Chris,
That’s a great suggestion. We’ll be doing these weekly during the regular season, so yeah, we’ll fit in a summary/Cliff’s Notes version at the bottom of most of these. Appreciate the kind words.