

Analytics, Basic Stats, and Recent Historic Context: The ABC’s of Penn State Football – PSU vs. Ohio State

Sponsor: Hey, it’s us! For The Blogy! Join our 2021 FTB Donors Club – the best way for you to show your support and keep this train rolling – and receive an exclusive FTB zipper bottle Koozie as a gift! Sign up HERE.
*Please remember to click the ‘Share My Address With For The Blogy’ box when checking out so we know where to mail your gift!
Introduction
Welp, another postgame analytics write-up following a Penn State loss, although this one is a little less demoralizing than the previous two. The Nittany Lions hung with the heavily favored Buckeyes from first whistle to last whistle but just couldn’t finish the job. Offensively, two big turnovers directly led to 10 Buckeye points, which was ultimately the difference in the game. The defense played very well and held the best offense in the conference, if not the nation, in check except for a few backbreaking chunk plays. Once again, this game reaffirmed a couple of things: 1. Penn State remains Ohio State’s toughest competition within the Big Ten year in and year out. And 2., the gap between Ohio State and everyone else in the conference is really, really wide.
Quick Hitters
- The -2 turnover margin lowers Franklin’s record at Penn State to 6-8 in such games. Right up until the final Ohio State scoring drive that stretched the Buckeyes lead to two possessions, Penn State remained within striking distance despite coughing up the ball to the scarlet pants three times – a scenario/circumstance that’s both fairly remarkable and incredibly frustrating.
- Ohio State generated 164 of 466 total yards on 3 of its 68 total plays (the 68-yard run by TreVeyon Henderson; the 58-yard reception by Smith-Njigba; and the 38-yard Chris Olave touchdown). That’s 35% of their total yards on 4% of their offensive snaps…which is why Explosivity remains a key analytic category in determining offensive success.
- Going into Saturday, OSU averaged 6.1 points per Red-Zone attempt. Penn State held them to 19 points on 6 RZ attempts (3.2 points allowed/RZA). Currently, Brent Pry’s defense ranks 3rd nationally in points allowed/RZA at 3.0 (UGA leads with 2.9).
Basic Statistics
Out of all of the Basic Stats, Penn State only “won” the total number of plays metric. As we search for other positives, Penn State essentially broke even in Time of Possession, so there’s that. Possessing the ball and regularly generating first downs on third down help keep Penn State’s defense fresh throughout the entire game. Except for the (frustrating) big plays mentioned above, the defense played up to its usual standard – which is notable considering how long Illinois kept them on the field seven days earlier. The run defense held up extremely well throughout the game with one notable exception. If you subtract Henderson’s monster gain (which you can’t, but we will for sake of argument) Penn State limited Ohio State to allowed only 2.8 yards-per-rush.

On the flipside, Penn State’s run game is, ummm…(how should we say this?)…pretty bad. The Lions’ 33 rush yards ranks as the worst output of the non-sanction years of the James Franklin era – technically, it’s the second-worst behind the whopping 16 yards Penn State generated vs. Ohio State in 2014, coincidentally a game that was also a near upset. As it has been for years now, Penn State’s offensive line has been a major liability this season. Penn State OC Mike Yurcich has been able to lessen that lack of production with short passes to the perimeter. I don’t have stats on how many passes Clifford threw within 2 yards of the LOS but I’d bet it was 10 or more. While they don’t “count” as runs, it’s been an area where the offense has been very effective and seems to be the only substitute we’ll have for a dependable rushing attack.
Advanced Stats is Going Head-to-Head
On the Thursday or Friday before each game, I post a preview on Twitter (@PSU_Analytics) that highlights some of the key stats for Penn State and their opponent. If you’re not familiar with those previews, what’s wrong with you?!?!?! While you ponder that question, let’s examine PSU-OSU projected output vs. actual output in several key advanced stats categories, shall we?
First, Offensive Yards per Drive (YPD).
For the game, Penn State possessed the ball on 13 drives and Ohio State 11 (we took the end-of-game kneel out). Penn State’s 394 yards on those 13 drives yields 30.3 YPD (not counting penalty yards) while the Buckeyes generated 466 yards for an average of 42.4 YPD. In the table below, we see these in-game values along with each offense’s averages entering Saturday’s showdown, as well as the YPD each defense has allowed and the FBS average. I know, it’s a lot.

So what do we see? Well, in 2021 Penn State offense has generated less YPD than the FBS average while the OSU offense has surpassed that same average by about 9 yard. Both defenses entered Saturday’s contest better than average.
Against Ohio State, the Nittany Lions defense gave up quite a few more yards than they normally do but still managed to hold the OSU offense to 6 yards below its average, which is about all you can ask for when facing a potent attack littered with 5-star weapons. The Penn State offense, despite compiling a few lengthy scoring drives failed to meet its projected YPD output. Yurcich’s bunch beat their typical average of 28.1 YPD but was still slightly below the Buckeyes defense’s average allowance of 30.8. Penn State’s offensive drives went for the following number of yards (penalty yards are included here): -1, 89, 2, 38, 3, 32, 46, 75, 10, 75, 15, 5, 44 (scoring drives bolded). In a vacuum, those numbers don’t look that bad. Against 9 of 10 teams, those drive charts are likely good enough to win. But against the Buckeyes, who had only one 3-and-out and only two drives of <20 yards, you have to sustain drives and consistently put up points.
Switching gears to points-per-drive (PPD)…here, the Buckeyes scored 33 points on 11 drives (including the scoop-and-score) for a 3 PPD average while the Lions scored 24 on 13 (1.8). Even with the defensive score, the Nittany Lions held Ohio State to 79% of its season average. That’s phenomenal…a metric that provided Penn State a puncher’s chance of pulling off the upset.
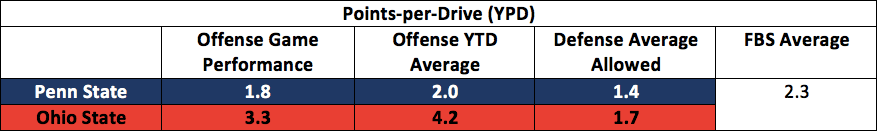
Conversely, Penn State’s offense was rather underwhelming in this same category. The Lions barely outpaced the Buckeyes average defensive allowance and finished below their own season average AND the FBS average. Echoing what we typed earlier, against 9 out of 10 teams, Penn State’s PPD would be good enough to win. But not against Ohio State.
Finally HAVOC – both generation and avoidance.
As a refresher, Havoc is the percentage of plays where a defense generates a sack, tackle-for-loss, fumble recovery, or interception. Havoc avoidance is the % of plays where an offense allows these bad things to happen. Somewhat surprisingly, HAVOC has been an area of concern for Penn State throughout the year on both sides of the ball. As well as the defense has played, they haven’t been generating the sacks and TFLs that they have in recent years. On the other side of the ball, Penn State’s offense has been basically average in avoiding Havoc. To me, the continuation of this trend was THE (thank goodness OSU failed to gain that trademark application years ago so we can use THE royalty free) determining factor in the game on Saturday. The Penn State defense generated only 8 Havoc plays (1 fumble recovery and 7 TFLs) during the Buckeyes 68 offensive plays, good for a Havoc rate of 12%. Contrast this with Ohio State’s defense. The Buckeyes generated 15 Havoc plays (2 fumble recoveries, 1 INT, 4 sacks, and 8 TFLs) throughout Penn State’s 81 snaps for a Havoc rate of 19%.

The Ohio State offense has been fantastic at avoiding Havoc through the first eight games of 2021. Including Saturday, they’ve run 532 plays and allowed 25 TFL, 9 sacks, 4 INT’s, and 2 lost fumbles. Penn State’s offense has run 495 plays and allowed 47, 14, 7, and 2 in the same respective categories. Nearly 10% of Penn State’s snaps yield a TFL where OSU has a rate of <5%. That’s quite a big difference.
In the game on Saturday, the lack of pressure on CJ Stroud was pretty apparent each time he dropped back. According to ESPN, the Penn State defense was credited with 1(?!?) QB hurry in 34 OSU pass attempts. Sean Clifford was sacked four times and hurried another five times in 52 pass attempts.
Coming back to the point at the beginning, the sacks, hurries, TFLs, and to at least some extent, the very rough interception and defensive score that the Buckeyes defense had are a direct result of the play of the Penn State offensive line. To close the gap that still exists with Ohio State the line must become a definitive strength of this team. As of now, it’s still, very unfortunately, a liability. That’s the difference between great and elite.


Leave a Comment