

Analytics, Basic Stats, and Recent Historic Context: The ABC’s of Penn State Football – PSU vs. Iowa, Relative Performance Index

Sponsor: Hey, it’s us! For The Blogy! Join our 2021 FTB Donors Club – the best way for you to show your support and keep this train rolling – and receive an exclusive FTB zipper bottle Koozie as a gift! Sign up HERE.
*Please remember to click the ‘Share My Address With For The Blogy’ box when checking out so we know where to mail your gift!
Introduction
Raise your hand if you predicted back in August that this Saturday’s Penn State-Iowa tilt shoehorned inside Kinnick Stadium would feature a pair of Top 5 teams.
Put your hand down, liar.
Sure, Blue-and-White/Black-and-Gold LASIK patients might have envisioned early season success for their OWN team, but given the September gauntlet the Nittany Lions and Hawkeyes both faced it’s a minor miracle neither squad has a blemish in 2021. And so here we are, just a few days away from the biggest Big Ten game that didn’t include Ohio State since…since…man, IDK. The 2015 Big Ten Championship between Top 5 Iowa and Top 5 Michigan State?
Relative Performance Index
For those of you with zero patience who are dying to know what past data suggest we’ll see on Saturday, we’re going to reintroduce the Relative Performance Index (RPI) methodology. We previously used this tool to forecast the Penn State versus Auburn game, specifically the expected performance of Penn State QB Sean Clifford and Bojangles spokesperson Bo Nix. Today, instead of focusing on one position, we’re going to look big picture. We are going to examine several stats – yards-per-pass attempt (YPA), yard-per-carry (YPC), yard-per-play (YPP), total plays, points-per-game (PPG) – from both offensive and defensive points of view and determine how well Penn State and Iowa do against their opponent averages. We will only consider stats compiled against FBS opponents from 2021 (so the Villanova game is out).
For those curious how this all works, here’s a step-by-step example from the Iowa-Indiana season opener. Here’s how we calculate the RPI for offensive PPG:
- Iowa scored 34 points versus Indiana
- For the year Indiana has played 4 games versus FBS competition and has allowed 31.8 PPG
- Removing the Iowa-Indiana game from Indiana’s average gives them an “adjusted” PPG allowed of 31.1 PPG
- Iowa’s RPI for PPG scored versus Indiana = 34 / 31.1 = 109%.
- We then repeat this process for the rest of Iowa’s opponents to get their average RPI for offensive PPG metric.
- Repeat for the other stats on offense and defense.
For the graphs I will focus on using the percentages like we showed you in No. 4 above. For simulations and predictions, I will use a +/- determination instead.

Offensive Performance
Let’s start with the various offensive stats as compared to what the opposing defense typically allows. Values greater than 100% mean that Iowa or Penn State outperformed their opponents’ averages.
The first graph lays out rushing yards-per-carry (YPC). Here we see that, generally, Iowa performs to expectation but rarely exceeds expectations. That’s why there are a bunch of opponent logo clustered around 100%. The exception is the Iowa State game , buried at the bottom. The Cyclones held the Hawkeyes to 1.7 YPC versus an adjusted average of 3.2 YPC.
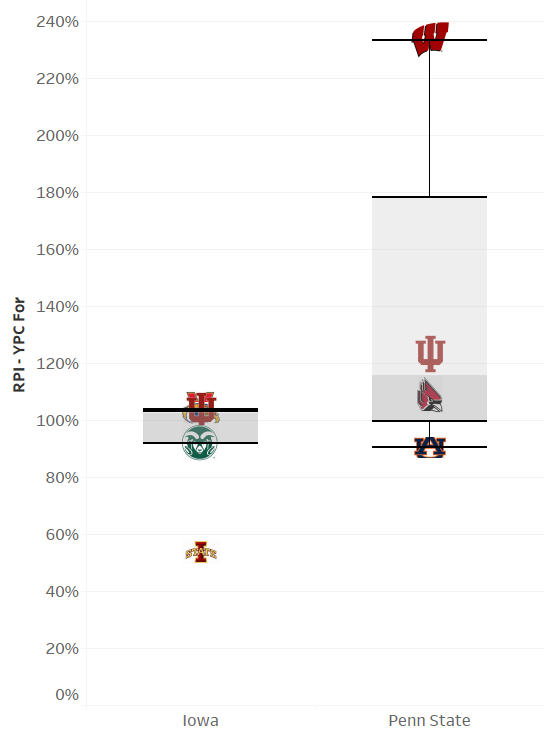
Penn State, on the other hand, generally outperforms expectation and (surprisingly) greatly outperformed expectations in the Wisconsin game (2.8 YPC actual versus 1.2 adjusted average). Auburn was the one game where Penn State underperformed albeit only to 90%.
Looking next at Yards-per-Play (YPP) gained, we see a similar situation where Penn State averages 20% more yards-per-play than the adjusted opponent average. The Indiana game was the Nittany Lions worst YPP RPI but still met expectations.

Iowa averages about 10% less than the opponent allowance and only finished above the adjusted average once (Colorado State). We will come back to this stat in a minute, but note that on defense Penn State and Iowa currently allow 4.26 and 4.12 YPP respectively – the top two stingiest marks in the Big Ten.
Moving on to scoring. When it comes to scoring, Substantial difference in this statistical category that heavily favors the Hawkeyes. Iowa averages an RPI of 165% in scoring versus opponent adjusted average while Penn State is at 110%.

At first glance, you probably spotted that low-placed Wisconsin logo and cringed. You’re not wrong in doing so. From a scoring standpoint, Penn State severely underperformed that game. This is especially true when you consider PSU outperformed the expected YPP by 150% against the Badgers. One thing to keep in mind, though: Wisconsin’s points allowed is skewed by multiple scores surrendered by the Badgers offense and special teams.
Similarly, Iowa’s scoring output against Maryland and Iowa State – two games where the Hawkeyes outperformed expectation (despite not moving the ball well) – was aided big-time by its crew of takeaway ninjas on defense. Simply put, the key to keeping Iowa from scoring is to protect the ball and prevent short fields. For Penn State on Saturday, punting is winning. These last two plots, when examined together, illustrate that point about as well as anything. Iowa’s offense hasn’t proven it can consistently move the ball and sustain long drives for a whole game, yet somehow the Hawkeyes score lots of points. Think Iowa’s mind-boggling +12 turnover margin has something to do with that? Because we sure do.
Defensive Performance
Now it’s the defenses turn. Um, they’re good. But HOW good are they? To answer that, let’s first look at yards-per-pass attempt allowed. Generally speaking, both teams are excellent in this category with only one instance of underperformance (Iowa against Kent State). In this metric (and therefore, in this chart below) lower numbers are better. Overall, Iowa’s average (75%) tops Penn State’s (82%) but any and every defensive coordinator in the country would be smitten with either percentage.

Looking at YPP allowed, we find that Iowa is pretty dominant, overall. The Hawkeyes have not allowed above 81% YPP versus average whereas Penn State gave up 100% (Ball State) and 97% (Indiana). Side note: that 97% against Indiana had Penn State allowing only 4.6 YPP which is very good. Indiana’s offense is just bad.

These numbers and percentage hint that our wagering readers should bet the under..if you want. Who am I to tell you how to blow your money, ya know? On average the Hawkeyes allow 43% of opponent average and Penn State allows 44%, therefore it’s safe to assume there’s very little chance that either team scores their seasonal average (33 for Iowa and 28 for PSU) on Saturday.

Pulling it all together, what do I think? As stated above – it’s pretty clear that the Hawkeyes offense will likely struggle to move the ball whereas the Nittany Lions offense will probably stack yards at a higher than Iowa average allowed rate. Unfortunately for PSU fans, Iowa leads the Big Ten in YPP against at 4.12. So, even if Penn State outperforms by 20%, as their offensive RPI would dictate, Mike Yurcich and Co. would only be getting to 5 YPP (compared to PSU’s offensive seasonal average of 5.8 YPP).
Using RPI to predict a score, we can take a combination of Penn State’s scoring rate (28 PPG) times the Iowa defense RPI (43%) and vice versa (Iowa scoring allowed and PSU offensive RPI). Doing so gives us a predicted scoring range between 12 and 13 points (gulp). On the other side of that ball, using the same equation, we’d expect Iowa to score between 15 and 18 points. This however is not my prediction.
Iowa’s two highest RPIs in terms of offensive performance were against Maryland and Iowa State — contests where the Hawkeyes defense generated 7 and 4 turnovers, respectively. In every Iowa game this season, there’s been a strong correlation between total points and turnovers forced. Conversely, Penn State’s offense has averaged a meager (in a good way) 0.6 turnovers per game. If and the Nittany Lions did suddenly start coughing up the rock on Saturday, their Red Zone defense is the second best in the country, allowing 2.6 points per red zone trip during the 13 times opponents have crossed the 20-yard line this season (Georgia ranks No. 1 with 1.8 points allowed per trip).
Anyway, should be a good one. Let’s hope that WE ARE the ones celebrating on Saturday night!

Always enjoy the content on this site. I think this is one case when removing garbage time is really important. Doing so wouldn’t be that tough, since we are only talking about a handful of games here. Fact of the matter is that Ball State scored nothing until garbage time, against our 3rd and 4th string. Same with Villanova. Meanwhile, Iowa wasn’t good enough to put their reserves in against Colorado State. They are a great defense, but they haven’t been statistically punished by garbage time like PSU has. Factor that in, and I am guessing your RPI would be more on the lines of 13-13.