

Analytics, Basic Stats, and Recent Historic Context: The ABC’s of Penn State Football – PSU vs. Indiana

Sponsor: Hey, it’s us! For The Blogy! Join our 2021 FTB Donors Club – the best way for you to show your support and keep this train rolling – and receive an exclusive FTB zipper bottle Koozie as a gift! Sign up HERE.
*Please remember to click the ‘Share My Address With For The Blogy’ box when checking out so we know where to mail your gift!
Introduction
Another Monday morning, another tolerable trip into the office as we all ride the high of another Penn State victory – the Nittany Lions fifth this season and ninth in a row dating back to last season’s fake season. Against the Hoosiers, Penn State’s defense was its normal dominant self. Nuff said there. The offense, for really the first time in 2021, showed a pulse in the run game while the normally in-tune passing attack sputtered along as if a few hazard lights popped up on the dashboard. We’ll explore those trends and much more as we patiently wait for one of the biggest football weekends in many a year.
Quick Hitters
- The 24-0 Stripeout shutout over Indiana was Penn State’s first defensive shutout since the Lions beat Maryland 59-0 in the Terps’ first Friday night “Blackout” – a tradition that should probably be stuffed in storage after Iowa’s most recent Blackout trouncing three days ago. As was shown on the ABC broadcast, Saturday marked the first time the Hoosiers have not scored in a game since they lost 58-0 to Drew Henson’s Michigan squad in October 2000.
- My love of Jordan Stout continues to grow. Against Indiana he had 4 of 6 punts rest inside the Indiana 20-yard line, drilled a 50-yard field goal that might have been good from 60, and had all of his kickoffs go for touchbacks. He’s an incredible weapon and, despite a couple of missed kicks, has absolutely been a net positive for the Lions.
- Along with Penn State’s win last night, the Auburn Tigers had a comeback victory against LSU in Death Valley. Auburn defeated the Bayou Bengals 24-19 in a game where Auburn racked up 453 yards of offense. This is obviously a huge shock since we were told that any SEC stadium, and especially Tiger Stadium, was an impossible environment for a visiting team to win, while Beaver Stadium proved no challenge to a vaunted SEC team. The universe is just fickle sometimes, I guess.
Basic Statistics
Yes, the entire left column of the chart below is highlighted green, but even so, Penn State dominated this game more than the stats suggest. The 264 yards and 4.6 yards-per-play allowed by Brent Pry’s bunch are Top 20 defensive numbers. The offense never really found a consistent rthytm yet still managed to rack up 408 yards from scrimmage. The Lions once again won the turnover battle, which continues to be a welcomed improvement versus 2020.
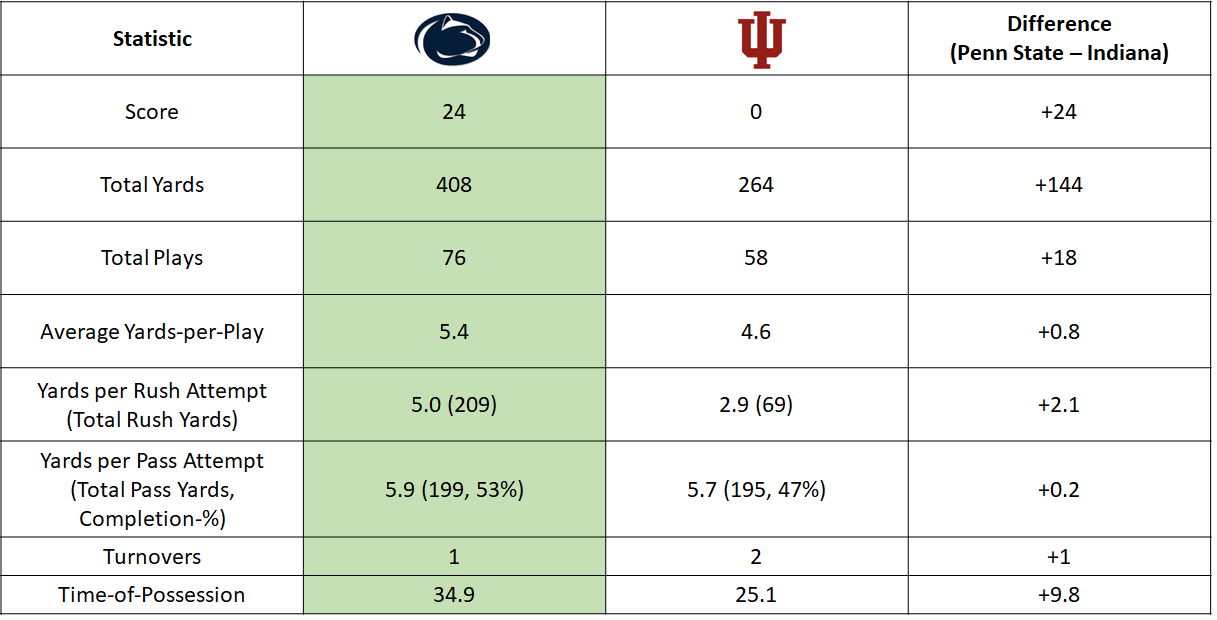
Thanks to strong runs from Sean Clifford and Keyvone Lee, Penn State posted 5.0 yards per carry – its best average of the season. Conversely, the passing game took a small step backward as Penn State completed 53 percent of its throws, a season low. With upcoming marquee games against Iowa, Ohio State, and Michigan left to play, Clifford’s completion percentage will need to rebound if Penn State plans to contend for the Big Ten crown.
Advanced Stats – 3rd and 4th Down Conversions
Watching the game against Indiana I couldn’t help but think, “Man, we really need to do a better job of converting 3rd downs, especially 3rd and short.” So I reached out to Bill Connelly at ESPN who is the creator of SP+ which is the preeminent advanced analytics tool in college football. One of the key factors of SP+ is “Success Rate” which is a measure of how much yardage an offense generates based on down. On first down “success” is gaining 50+% of the yardage (5 or more yards on 1st and 10). On 2nd down, a team should gain 70+% and on 3rd and 4th the offense must gain 100+% of the required yards for success. I asked Bill, “What’s the rough average success rate on 3rd down when it’s 3 yards or less?” Translated, this means – what percentage of the time does an offense generate the needed yards in 3rd and short situations. His response is pasted below:

Thanks to Bill C. for the quick response. Anyway, using those percentages listed above as our baseline, I wanted to examine how successful Penn State has been on 3rd downs and in 3rd/4th and Short situations this season. Per usual, I only used stats from games against FBS opponents, so no Villanova numbers here.
Let’s start by just looking at the average yards-to-go (YTG) and opportunities by opponent. Against Indiana and Wisconsin, the Lions offense had an average of 7 yards to go per 3rd and 4th down attempt (not counting punts). Against Auburn, that average dropped to 4.3 yards to go. The chart below breaks down the total number of 3rd downs/non-punt 4th downs (bottom number) and the average yards to go (top number) in each game. None of these data points are great for Penn State. You’d like to see the offense do a better job of staying “on schedule” — 3rd and Short — rather than needing to convert 7+ yards on 3rd down. Obviously, Penn State has proven it can move the ball, but the average distance to go on 3rd down has been troubling. If 3rd downs are inevitable – which they are, no matter how good your offense is – then it’s obviously better to have a shorter distance to go to move the chains. Mind-blowing, huh?
 Next, let’s look at play type by yards-to-go. In the chart below, we see that out of 45 3rd and 4th down attempts Penn State has 23 runs and 22 passes. Note that occasionally a “sack” is mislabeled as a run. The average YTG between runs and passes are pretty comparable and illustrate that Yurcich doesn’t really have a huge tendency one way or the other…which is good. Shows he’s not predictable.

Next, let’s look at a scatter plot of the YTG (X-axis) and Yards Gained (Result, Y-Axis). Run plays are squares and passes are circles. Blue means the offense was unsuccessful (gained less than YTG) and orange means successful.
 Quantifying success rate we find some very interesting trends. “Yes” or “No” reference whether or not the play was successful, run or pass is obvious, and the numbers are YTG and total count of each circle.
 So, in successful run plays, the average YTG was 8.6 and the average unsuccessful play was 4.9 YTG – which is kind of bizarre when you think about it. The successful runs are the orange squares in the previous graph (up to 22 yards). So what’s the explanation? Well, perhaps in 3rd and Long situations teams are expecting pass and they’re surprised with runs (or Clifford scrambles). For pass plays, successful plays are slightly shorter (6.4 yards) than unsuccessful plays (6.9 yards). Overall, for 3rd and 4th down attempts, the overall success rate is 36% independent of distance to go (16/45).
Finally, we get to the crux of the issue and we’ll look at Success by YTG in the final graph of the day. Here, the y-axis is the count and the x-axis is the “bin” of YTG (0 = 0 to 3 yards; 3 = 3 to 6; etc.).
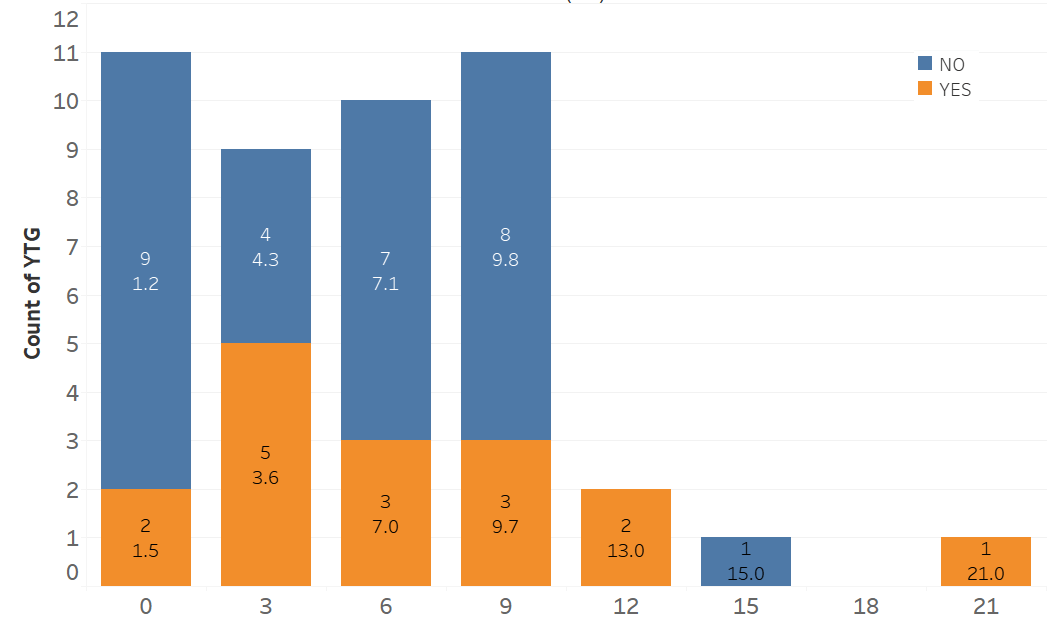 Remember, from Bill C., the average conversion success rate on 3rd and 3 (or less) should be about 68%. Currently, Penn State has a success rate of 18% (2 out of 11)! Ouch. For plays over 3 yards (all the other bars), the success rate is 31% (14/44). What’s more, the average yards to gain of all the unsuccessful 3rd and 3 or lesses attempts is just 1.2 yards. If Penn State is going to have long-term success against the best defenses in the Big Ten these short conversions MUST improve. Every team has flaws but to me, this seems a potentially fatal flaw that could derail a magical season.

Leave a Comment