

Analytics, Basic Stats, and Recent Historic Context: The ABC’s of Penn State Football – PSU vs Wisconsin

Sponsor: Hey, it’s us! For The Blogy! Join our 2021 FTB Donors Club – the best way for you to show your support and keep this train rolling – and receive an exclusive FTB zipper bottle Koozie as a gift! Sign up HERE.
*Please remember to click the ‘Share My Address With For The Blogy’ box when checking out so we know where to mail your gift!
Introduction
Welcome back! The 2021 Penn State football season started out with a nerve-racking but overall successful road game against a tough Wisconsin team. Through 30 paint-drying minutes, Penn State’s offense ran 22 plays and racked up a whopping 43 yards. Then, for whatever reason, the script flipped after halftime. Penn State got in a rhythm, went up-tempo on the first drive, hit Dotson deep for six, and teased us with what could be in Mike Yurcich’s offensive system. Truly it was a tale of two halves. – the best of times, the worst of times, an age of foolishness, an age of wisdom…all in four quarters.
Quick Hitters
Before we get into the numbers and nerdy stuff, we’re adding this section featuring 3 stats from offense, defense, or special teams that dictated the outcome of the game. Here we go…
- For all of the criticism that Jordan Stout will get this week for missing an extra point and a FG from extra-point distance, don’t overlook that he averaged 53.9 yards-per-punt on 7 punts against Wisconsin. Those hidden yards on special teams often times are the difference between victory and defeat, especially in a low-scoring donnybrook like what we saw on Saturday.
- Penn State finished +3 in turnover margin on Saturday. Out of 89 games with James Franklin as the head coach, the Nittany Lions have been +3 or better in 9 games – all wins.
- Two weeks ago, we wrote about Penn State’s Defensive Scoring Efficiency (points allowed per-drive. PPD for short) being far worse in 2020 than previous years. In 2020, the Lions allowed 2.3 Points Per Drive. Against Wisconsin, the defense allowed an incredible 0.78 PPD. The best Defensive Scoring Efficiency mark since 2009 belongs to the 2011 Alabama defense that allowed 0.62 PPP for the entire season. This Nittany Lion team (probably) won’t sustain this rate but, man, did they need every bit of that performance on Saturday.
Basic Statistics
The basic stat table is below. It’s the same as last season format-wise. Sort of a mixed bag in terms of which team won each stat category but Penn State dominated in the important ones: points, yards-per-play (YPP), and turnovers. Points is obviously the most important stat but YPP and turnovers are excellent predictors of wins and losses. I am a bit surprised that PSU won the YPP margin by 2 full yards. It seemed like Wisconsin was generating decent yardage in the run game but apparently not enough to muster more than 3 yards-per-carry and 3.8 YPP. Penn State’s 3.8 YPP allowed on defense ranks as the 15th –best performance under James Franklin (the Lions are 13-2 in those games).
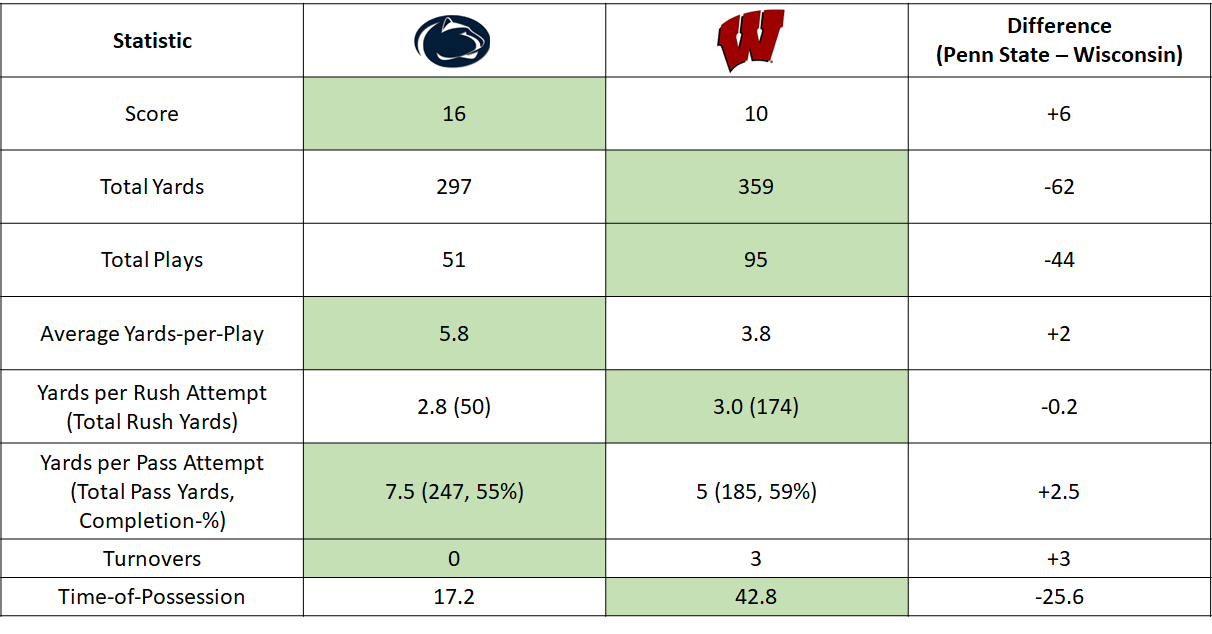
The big negative here for Penn State is in Time of Possession and plays allowed. It will be impossible to keep the defense healthy and fresh being on the field for nearly 100 plays per game. Going forward the offense needs to do more to control the game.
Advanced Stats – A Tale of Two Halves
Offensive Efficiency
First, I prefer using two stats to illustrate offensive efficiency: yards-per-drive (YPD) and points-per-drive (PPD). We already talked about the Penn State’s incredible Efficiency performance on defense. Well, as good as the defense was, the offense was equally as bad in the first half. I mean, just look at the numbers below, starting with YPD:
| Yards-per-Drive (YPD) | ||||
| Penn State 2020 Average | FBS Average
(2009 – 2020) |
1st Half vs. Wisconsin | 2nd Half vs. Wisconsin | Full Game vs. Wisconsin |
| 34.3 | 31.9 | 7.2 | 42.3 | 22.8 |
Yikes. Well, first-half yikes, anyway. Penn State’s offense mustered 7.2 YPD on six possessions before halftime. That’s pretty bad. For context, since 2009, the worst YPD team was 2014 Wake Forest. The Demon Deacons averaged 15.6 YPD that season. Granted, the Wisconsin defense should be one of the best the Lions will face all year but an offensive genius like Mike Yurcich is paid to figure it out. Eventually, he did. Penn State’s 42.3 YPD in the second half, were it to be sustained for an entire season (which it can’t), would be in the top 3% of all FBS teams since 2009.
On the scoring side of the ledger, despite Penn State’s underwhelming 2020 offense, the Lions still managed to finish that forgettable year as an above-average scoring team. Against the Badgers, Penn State posted a big ol’ zero in the first half but rebounded and averaged 2.7 PPD in the second half. For the game, Penn State finished by scoring 1.2 points per drive – exactly half the Lions’ 2020 season average of 2.4 points per drive. But don’t worry too much. This was a formidable Wisconsin defense, after all. Since 2009, the Badgers defense has allowed opponents 1.6 PPD, which ranks 4th in the FBS behind only Alabama, Clemson, and Ohio State.
| Points-per-Drive (PPD) | ||||
| Penn State 2020 Average | FBS Average
(2009 – 2020) |
1st Half vs. Wisconsin | 2nd Half vs. Wisconsin | Full Game vs. Wisconsin |
| 2.4 | 2.2 | 0 | 2.7 | 1.2 |
Explosivity and Tempo
As I’ve outlined before, Tempo and Explosive Plays are the hallmarks of Mike Yurcich’s offense. As an offensive coordinator, Yurcich’s teams at Oklahoma State and Texas averaged 2.66 plays per minute – faster than any Penn State offense, even Bill O’Brien’s 2012 group with its NASCAR packages. Additionally, Yurcich has produced some of the best Explosivity ratings (yard*point / 100 plays / game) in modern college football – more explosive than Joe Moorhead’s record-setting 2016 and 2017 Penn State offenses.
In this game, regarding tempo, Coach Yurcich did push the pace in the first half at about his average rate. But look at the 2nd half number where he ran 3.22 plays per minute. This is 2016 Baylor-level speed and, combined with the field-stretching vertical attack I mentioned earlier, absolutely put the Badgers on their back feet and led to productivity.
| Tempo (Plays / Minute-TOP) | ||||
| Penn State 2020 Average | FBS Average
(2009 – 2020) |
1st Half vs. Wisconsin | 2nd Half vs. Wisconsin | Full Game vs. Wisconsin |
| 2.34 | 2.35 | 2.69 | 3.22 | 2.96 |
The PSU offense wasn’t particularly explosive in the first or second half of the game. Again, though, the opponent matters. Last year, Wisconsin only allowed opponents a 0.83 Explosivity Score. Since 2009, Wisconsin’s overall 0.93 Explosivity Score Against (hopefully that makes sense) ranks 2nd in FBS, trailing top-ranked Alabama. So while Penn State’s offensive production doesn’t look fantastic through one game, it’s actually a very good result against this Badgers defense.
| Explosivity (Point * Yard / 100-Plays) | ||||
| Penn State 2020 Average | FBS Average
(2009 – 2020) |
1st Half vs. Wisconsin | 2nd Half vs. Wisconsin | Full Game vs. Wisconsin |
| 1.63 | 1.61 | 0.00 | 1.62 | 0.93 |

Leave a Comment