

Analytics, Basic Stats, and Recent Historic Context: The ABC’s of Penn State Football – PSU vs. Villanova

Sponsor: Hey, it’s us! For The Blogy! Join our 2021 FTB Donors Club – the best way for you to show your support and keep this train rolling – and receive an exclusive FTB zipper bottle Koozie as a gift! Sign up HERE.
*Please remember to click the ‘Share My Address With For The Blogy’ box when checking out so we know where to mail your gift!
Introduction
To be honest, I’m writing this during the halftime of the Villanova game because the stats that we’re going to get out of this game don’t matter. Penn State is going to win. The defense has been awesome and will continue being awesome, Sean Clifford and Ta’Quan Roberson will throw for a couple more TDs (probably), and in all likelihood, the run game will keep spinning its tires. That’s where I want to focus today – the run game. In the first half of the Villanova game, the Nittany Lions averaged 1.1 YPC running the ball – well below their already-lackluster 3.8 YPC for the season. In the three games prior to Saturday, Penn State’s offense generated 68% of its total yards in the air. Against Villanova, 84% of Penn State’s 509 total yards came via the passing game. How does this bode for the team going forward? Has an FBS team had this uneven of pass/run ratio and been #elite?
Quick Hitters
- Jordan Stout looked good punting the ball against Villanova. In the first few games he has averaged over 50 yards per punt but had zero inside the 20. In the first half against Nova, he dialed two punts in perfectly that were downed at the 5 and 2 (he just got a 3rd downed at the 10).
- Eventually, the Penn State defense won’t drop pick-6’s, but in the 3rd quarter Ji’Ayir Brown added an interception to the overall tally (after having one negated by penalty earlier). This brings the season total to 5 through 4 games, which is already more than the defense had in 2020.
- Though Wisconsin lost, the Badgers held Notre Dame to 3 rushing yards on 32 attempts on Saturday. No, that’s not a typo. THREE! So, while Penn State’s run game performance against Nova was fairly uninspiring, the body of work to date gives me a bit of pause before being too worried.
Basic Statistics
Penn State beat Villanova in pretty much every way. In the end, the Wildcats gained 280 yards against the Nittany Lions defense but 169 of them came in the 4th quarter when Penn State had moved beyond its 2-Deep defensive roster. There’s not much else to analyze in the basics. It was a win and no one got hurt. That’s all you could ask for.

Advanced Stats – The Penn State Running Game
The current dichotomy of the PSU pass offense to the run game is one of the most frustrating things I’ve witnessed as a Penn State fan. Coming into the year the narrative was – “Getting Noah Cain back with the other RBs will give Penn State a steady running attack that will keep us in games. Can Sean Clifford just be competent and not turn the ball over?” Well, through three games the anticipated script has completely flipped. Clifford’s passing has been very good (with a few minor blips) while the running game makes me want to drink myself to sleep. I am dubious about whether the passing game success can be sustainable without the threat of run game long-term. So that’s what we’ll investigate today: Can a team that skews so heavy toward the pass, like 2021 Penn State, succeed in FBS?
Per usual, the stats we’re examining for come from 2009-2020 and include FBS vs. FBS games. In that time span, there have been 1,510 individual team seasons.
Let’s start by looking at the distribution of run to pass in regards to total offensive production. Here, I have divided a team’s rush yardage by their total offense to get the %-Run. Over the whole sample, an average team generates 42% of their yards on the ground and 58% through the air. The lowest run share on record was the 2012 and 2014 Washington State teams led by Mike Leach, which had a laughably-low 6% and 7% run share, respectively. You can see that I colored the bars by our familiar face offensive coordinators. The lowest percentages of this Penn State-related group were posted by the 2015 (26%) and 2017 (32%) Oklahoma State teams led by Mike Yurcich, so this type of uneven divide is not foreign territory for our OC. From a rank standpoint, the 32% run share PSU currently sports would rank in bottom 20th-percentile since 2009.
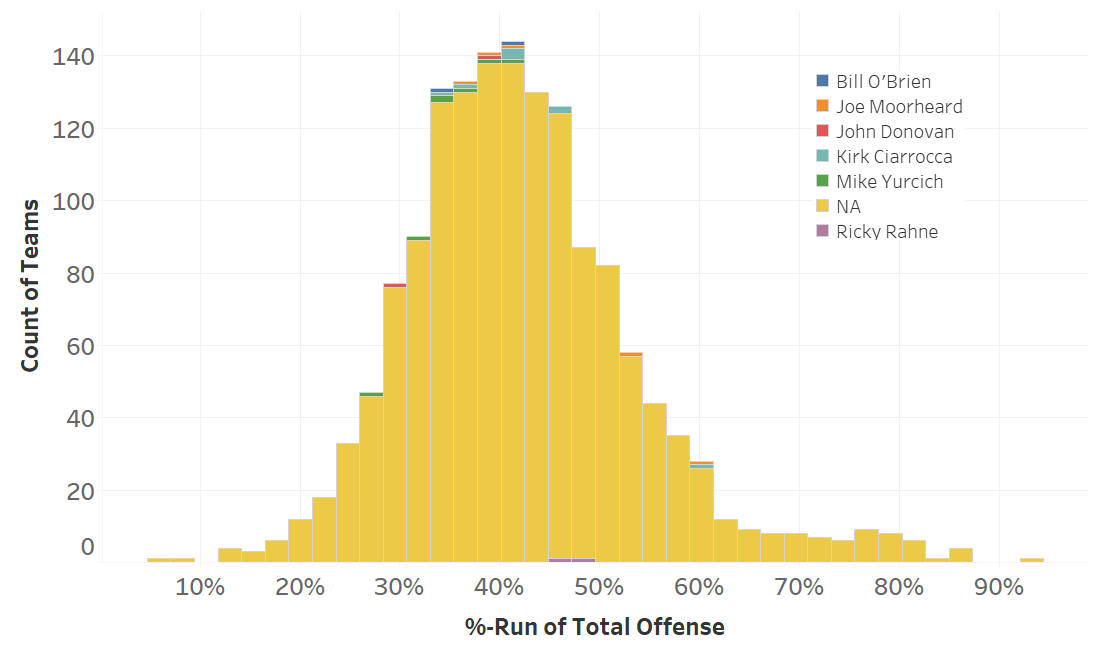
Next, let’s look at how this run-pass split trend has evolved over the years. And the answer is, it really hasn’t. Since 2009, the average has stayed right around 40% so even with more teams adapting to modern spread offenses, the run/pass balance has stayed fairly consistent.

Now, let’s look at Run-% with our efficiency metric of Yards-per-Possession (YPP) and Overall Effectiveness (OE) to determine if teams that are more run or pass dominant have better performance. If you squint just right at the YPP rorschach below you might be able to convince yourself that teams with a higher Run-% have better efficiency. This may be true among teams with very high Run-% numbers (70%) who tend to be very disciplined — Army, Navy, pre-Geoff Collins Georgia Tech, other teams that run unique ground-centric offenses that give opposing defenses fits.
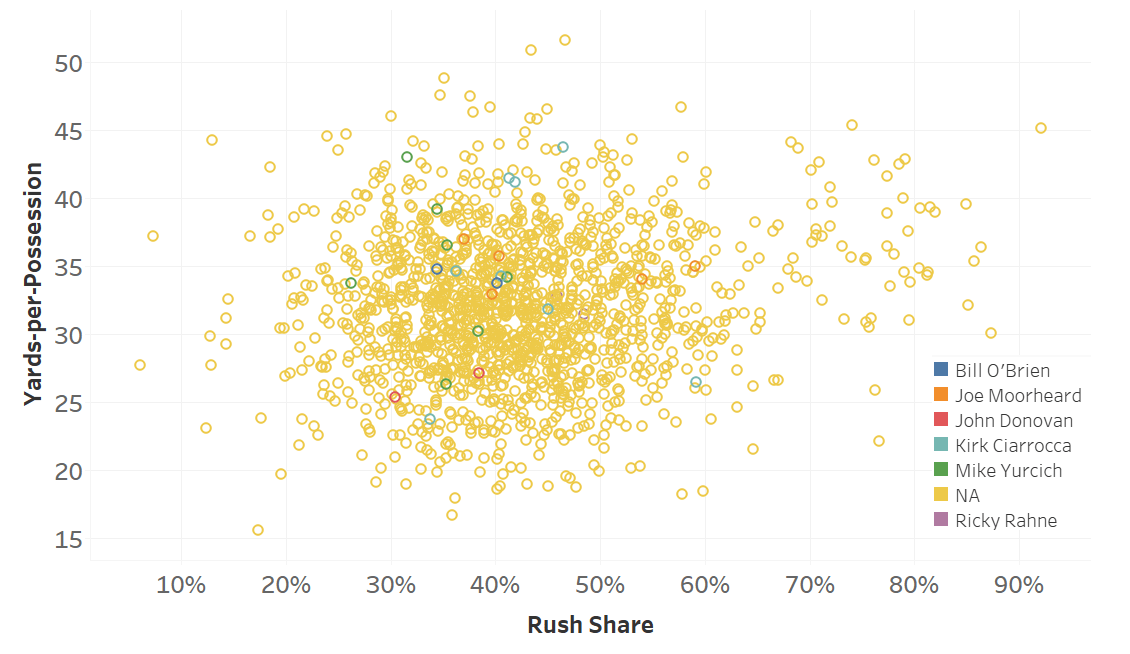
For the bulk of both graphs though, there’s not real trend in yardage efficiency with respect to Run-%.
For OE, the best teams (highest OE) have had run shares anywhere between 25% and 46%. Note that there have only been 53 teams (out of 1,510) who have finished with an OE above 50 in my rating. One of these teams, the 2017 Oklahoma State Cowboys coordinated by Mike Yurcich, had a run share of 32%. That club was the 17th most prolific offense in FBS since 2009. Now, that particular Oklahoma State team averaged 180 rush yards per game to go along with 389 pass yards, but the point stands.
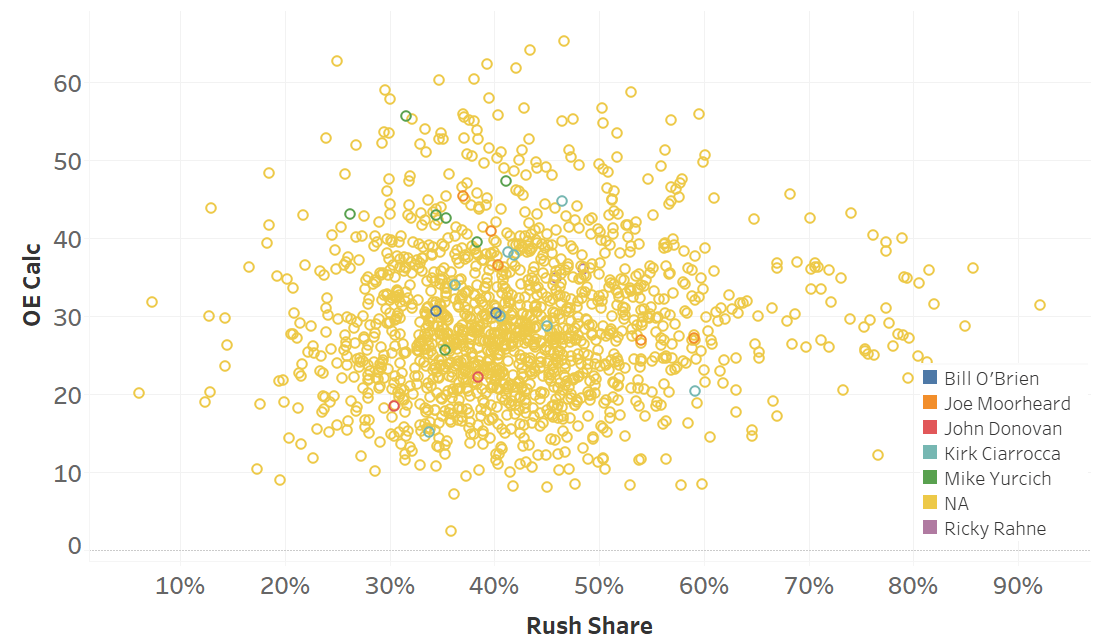
Let’s focus a bit more just on “our guys” in the graph below. Remember, 42% run yards are average and higher OE is better with 30 being the average since 2009. Mike Yurcich ALWAYS has a lower Run-% than average AND has above average OE. Joe Moorhead’s best teams had lower Run-%, too.

So, while watching this team try to run the ball has been very frustrating, it’s not time to panic just yet. If Clifford and the passing game keep doing what they’ve done in the first 4 games, Penn State will remain competitive. There’s enough short passing to go with the deep stuff to (hopefully) keep the efficiency numbers up. I worry about the 4-minute offense and trying to close games out on the ground but, on the flip side, the 2021 Nittany Lions’ explosivity rating has tremendous thus far – an aspect our offense hasn’t possessed since 2017. We’ll learn a whole lot more about the Penn State offense in the next two weeks but right now they’re doing the things that Yurcich was hired to do – move the ball and score.

Leave a Comment