

Analytics, Basic Stats, and Recent Historic Context: The ABC’s of Penn State Football – Is Sean Clifford More Trace McSorley or Christian Hackenberg?

Introduction
There has been a lot (too much?) talk in the off-season about Penn State’s need to upgrade its quarterback situation going into the 2021 season. Every time any FBS quarterback hit the Transfer Portal, message boards and Twitter exploded with speculation about Penn State’s interest, and whether said quarterback would be an upgrade over Sean Clifford. Heck, a vocal few even wondered if a strong spring from Ta’Quan Roberson or true freshman Christian Veilleux could be enough to supplant the incumbent quarterback.
All that talk made for great fodder from January to April, but it’s almost a foregone conclusion that Clifford will be the Game 1 starter in Madison, making him the 3rd three-year starter for Penn State in succession. That begs the question: as Clifford enters his third (and presumably final) season under center, how has his statistical performance compared to the numbers compiled by the previous two starters – Christian Hackenberg (2013-2015) and Trace McSorley (2016-2018)?
The answer, as you’ll see, is almost smack-dab in the middle.
Just Win Baby
To be fair, at big-stage programs like Penn State, the quarterback tends to get far too much credit when his team wins and handles far too much criticism when his squad underperforms. But that doesn’t stop pundits from analyzing and making a big deal of a QB’s win percentage. And as wannabe pundits, it’s not going to stop us, either.

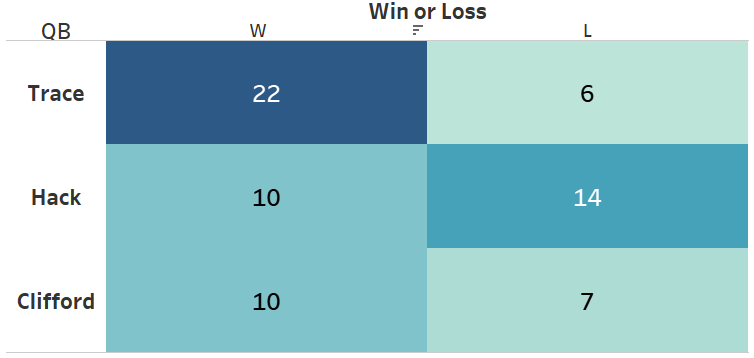
For 3 seasons, Trace McSorley won 31 games and lost 9 (78%), while Hackenberg didn’t fare quite as well at 21-17 (55%). Clifford, through his first two seasons is right in the middle with a 13-7 record, good for a win percentage of 65%. Keep in mind that this excludes two 2019 games — Idaho (FCS) and Rutgers (DNP).
When examining all three quaterbacks’ conference records, a bit of a chasm separates McSorley (79%!!) and Hackenberg (42%). Don’t forget, four of McSorley’s Big Ten losses (2017 and 2018 OSU and MSU) were by a combined 9 points. The other two losses with Trace McSorley at the helm were the larger losses to Michigan.
Clifford, again, is right in the middle. After going 6-2 in 2019, and then, as you all know, 4-5 in 2020, Clifford enters this season with a very meh 59% win mark in conference. That’s 20 percentage points away from McSorley and 17 away from Hackenberg.
Air it Out
The best college quarterbacks get paid (and by paid I mean scholarships, room and board, etc. and that’s it…cough) to throw the ball around the field. Running ability is a fantastic second skill but since it’s 2021 and not 1921, the forward pass is what makes offenses go.
We’ll start by looking at each quarterback’s completion percentage by year. The plot below shows each QB and the number of completions and attempts by their starting year (e.g. Trace – Year 1 = 2016; Clifford – Year 1 = 2019).

First, I find it quite interesting that Hack and Trace both had their most attempts in their 2nd years. Hackenberg averaged 32 attempts in 2013, 37 in 2014, and then only 27 in 2015. Trace, similarly, went 28, 33, and 28 attempts per game. Clifford, in his first two years, was more consistent averaging 27 and 28 attempts per game under two different coordinators.
All these attempts, combined with the completions, yield the following completion percentages. In quite an impressive coincidence, all three quarterbacks averaged within one percentage point in their first year. In their 2nd years, there was some divergence with Trace going to our high-water mark of 67% while Hackenberg dropped to 56%. Clifford, as with the win-%, was right in the middle at 61%. If he really is the average of Trace and Hack, then we can expect a 53% completion rate in 2021. We better hope that he’s not the average of Trace and Hack…
| Quarterback | Year 1 | Year 2 | Year 3 |
| Hackenberg | 59% | 56% | 53% |
| McSorley | 58% | 67% | 53% |
| Clifford | 59% | 61% | TBD |
Next, we will evaluate yards-per-pass attempt (YPA). In the graph below, we see the per game YPA for each QB with their overall average as the label. The colors are their starting year as above.

Again, Clifford is somewhere in between Hackenberg (7 YPA) and Trace (8.7 YPA) with a value of 7.8 YPA. An interesting observation from these data points though is that, for all quarterbacks, there doesn’t appear to be an obvious year-by-year trend. The different colored circles for each QB are fairly well spread across the chart. One thing that gives me some pause is the range of Cliff’s stats. He has 3 games with YPA numbers over 10 and two of those were in 2019. The other was the 2020 Illinois game. So in 15 percent of Clifford’s starts, his YPA has been greater than 10 yards. By contrast, Trace had 11 such games out of 40 starts (28%) and Hackenberg had only two.
Finally, for passing, let’s look at per game yards and passing TDs by year. Obviously, Trace’s two years under Joe Moorhead (2016-2017) stand out as the best of these 8 years. He averaged over 250 yards and 2 TDs per game in these two years before regressing some in 2018. Clifford has been actually quite consistent averaging 216 and 209 yards in 2019 and 2020 and 1.9 and 1.8 TDs per game. Both TD numbers exceed any year that Hackenberg had. Going into 2021, seeing some improvement would be great but if current averages are the “floor”, this would be a positive.

If we add interceptions to the plot, we still see a decent performance for Clifford versus the others. Yes, his 2.4 TD/INT is worse than McSorley’s 3.2 but far better than Hackenberg’s 1.6 but from 2009-2019, the FBS average against FBS competition was 1.8 and Cliff is well above that and in the top 25-percentile of FBS quarterbacks during the period.

Ground and Pound
Of course, passing is the main asset that QBs have but having the ability to consistently escape pressure and make things happen with their feet is also extremely valuable. If Trace McSorley didn’t have this skill, Penn State loses to Minnesota and Ohio State in 2016. And if Penn State drops those two that season the overall trajectory of the program is very different.
The graph below shows Hack, Trace and Cliff’s rushing yards in each game with the label as the average. Thankfully, here, Clifford is much more McSorley than he is Hackenberg. The Penn State offensive line from 2013-2015 was generally poor and Hackenberg’s -7 YPG rushing average is a function of both O-line play and his own limitations, but my goodness, that is far worse than I expected. Clifford and McSorley average 37 and 45 RYPG respectively, both of which seem perfectly adequate.

Interesting fact about our three quarterbacks and their rushing performances. Christian Hackenberg had zero or negative rushing yards in 22 of 38 games. Trace McSorley had zero or fewer yards in six games. Sean Clifford has had only one such game (2019 OSU). Yes, the offensive line is likely better in the last two years than it was in the previous six, but Clifford has a knack for eluding pressure and making good things happen with his feet. See my other posts about some of the negative performances of the Clifford teams with “Havoc Avoidance.”
In terms of rushing TDs. one of these guys is in another world than the other two. Trace McSorley ran for 30 TDs in his career (7, 11, and 12 by year) and 0.75/game. Hackenberg ran for 6 in his entire career. Clifford has run for 8 TDs in 20 games, about half the rate of Trace McSorley. So, again, Clifford is somewhere between the previous two QBs.
The Sum of the Parts
If we combine the production of the QB’s to generate yards through both the air and on the ground, we see that again, Sean Clifford is nearly the average of Hackenberg and McSorley. And when I say, “nearly the average,” if you average McSorley’s 284 YPG and Hack’s 216, you get 250 YPG. Clifford is at 247 or about 1% off that average.

While this has been a reasonably superficial statistical look at these three QBs, the question posed was: “Is Sean Clifford more Hackenberg or McSorley?” And to that question with these stats, I think the answer is slightly tilted to McSorley. SLIGHTLY. Statistically, Clifford is closer to Trace than he is Hackenberg. He’s a competent runner who has an above average TD/INT ratio and decent completion-%. But, in terms of total production, Clifford is nearly exactly the average of his two predecessors. Clifford’s legacy as a three-year starter is not yet cemented. After a sometimes rocky but overall successful 2019 season, followed by whatever 2020 was, it’s hard to define him at this time. Coordinator changes, no spring ball, a shortened season, a disastrous start to 2020 against Indiana are all contributing factors to not only Clifford’s poor second season, but also the team’s miserable COVID campaign, as well. I, like most everyone who will read this, are rooting for him to be more 2017 Trace McSorley this year but will also settle for 2019 Sean Clifford.
Notes:
- Data is taken from cfbstats.com or pff.com and includes only games against FBS teams unless otherwise stated.
- Plots, graphs, etc. are built in Tableau Public.


Leave a Comment